The Problem
Ask an operations team for an accurate picture of what is running, what depends on what, and what it costs, and you get three artefacts that disagree with each other: a Visio from two years ago, a CMDB nobody trusts, and a spreadsheet export from the billing console. None of them answers the question that matters during an incident or a change window: if I touch this, what breaks, and who cares?
I have sat in enough change-advisory meetings across banking, aviation and government to know the answer is usually "we think nothing, let's find out". The Cloud Relationship Engine is my answer to that. It discovers the estate directly from the cloud provider APIs, read-only, builds one graph of every resource and the relationships between them, and layers on what you actually need: what changed, what is exposed, what it costs, and which business service it belongs to.
It runs live as Meshlyr, and there is an open demo with a fully synthetic multi-cloud estate at demo.meshlyr.com where you can click around without signing up. Every screenshot in this post uses that synthetic demo data, including any dollar amounts shown.
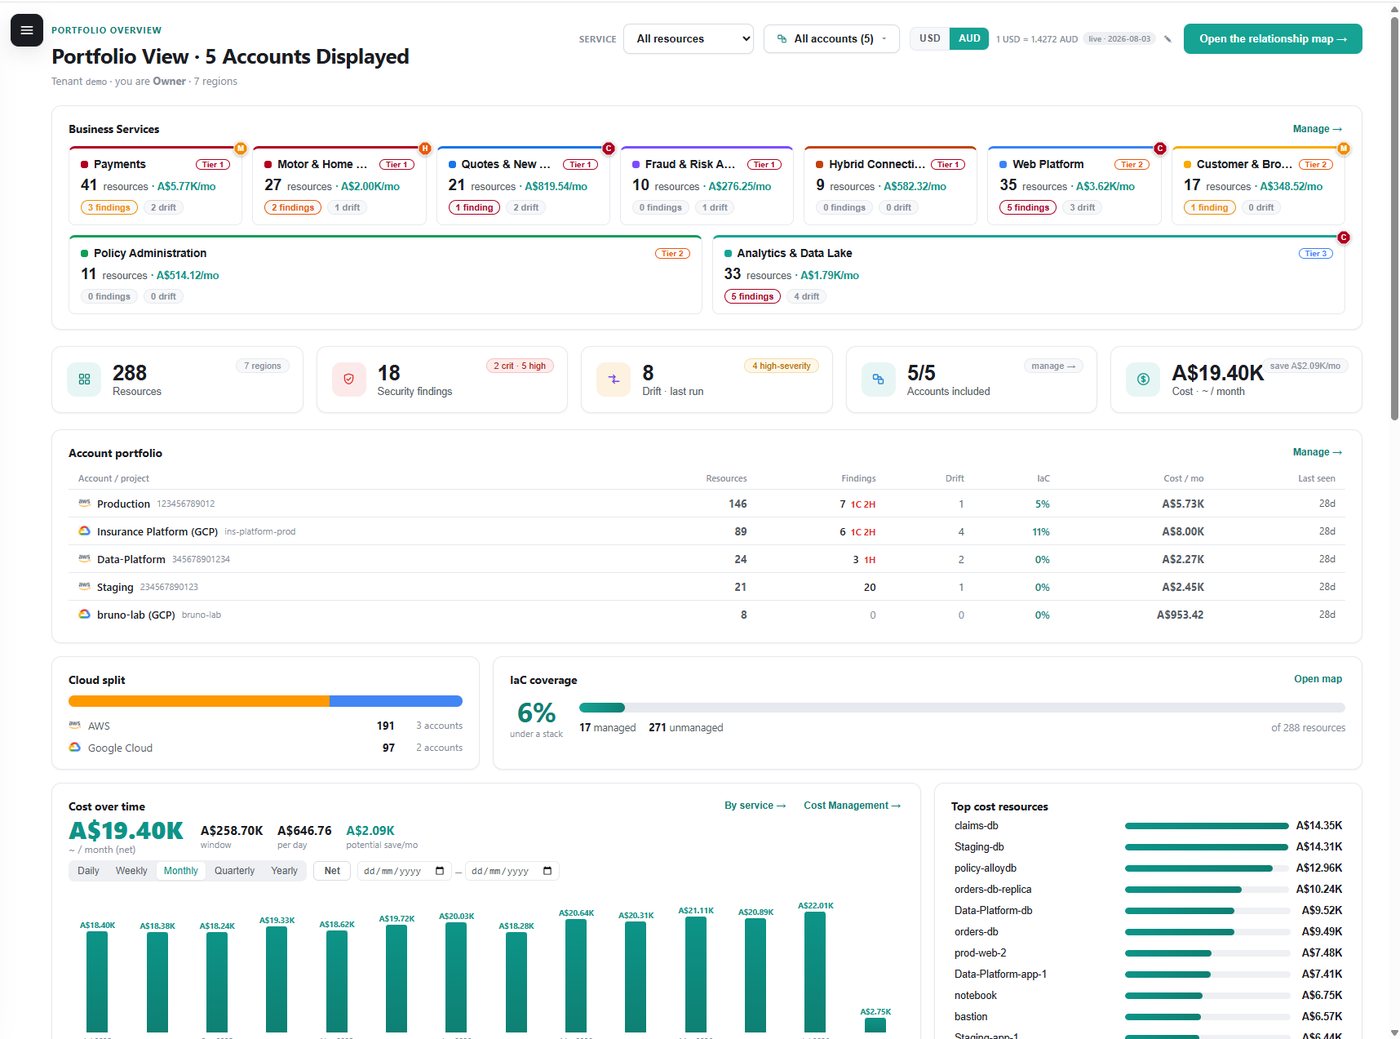
Feature Tour
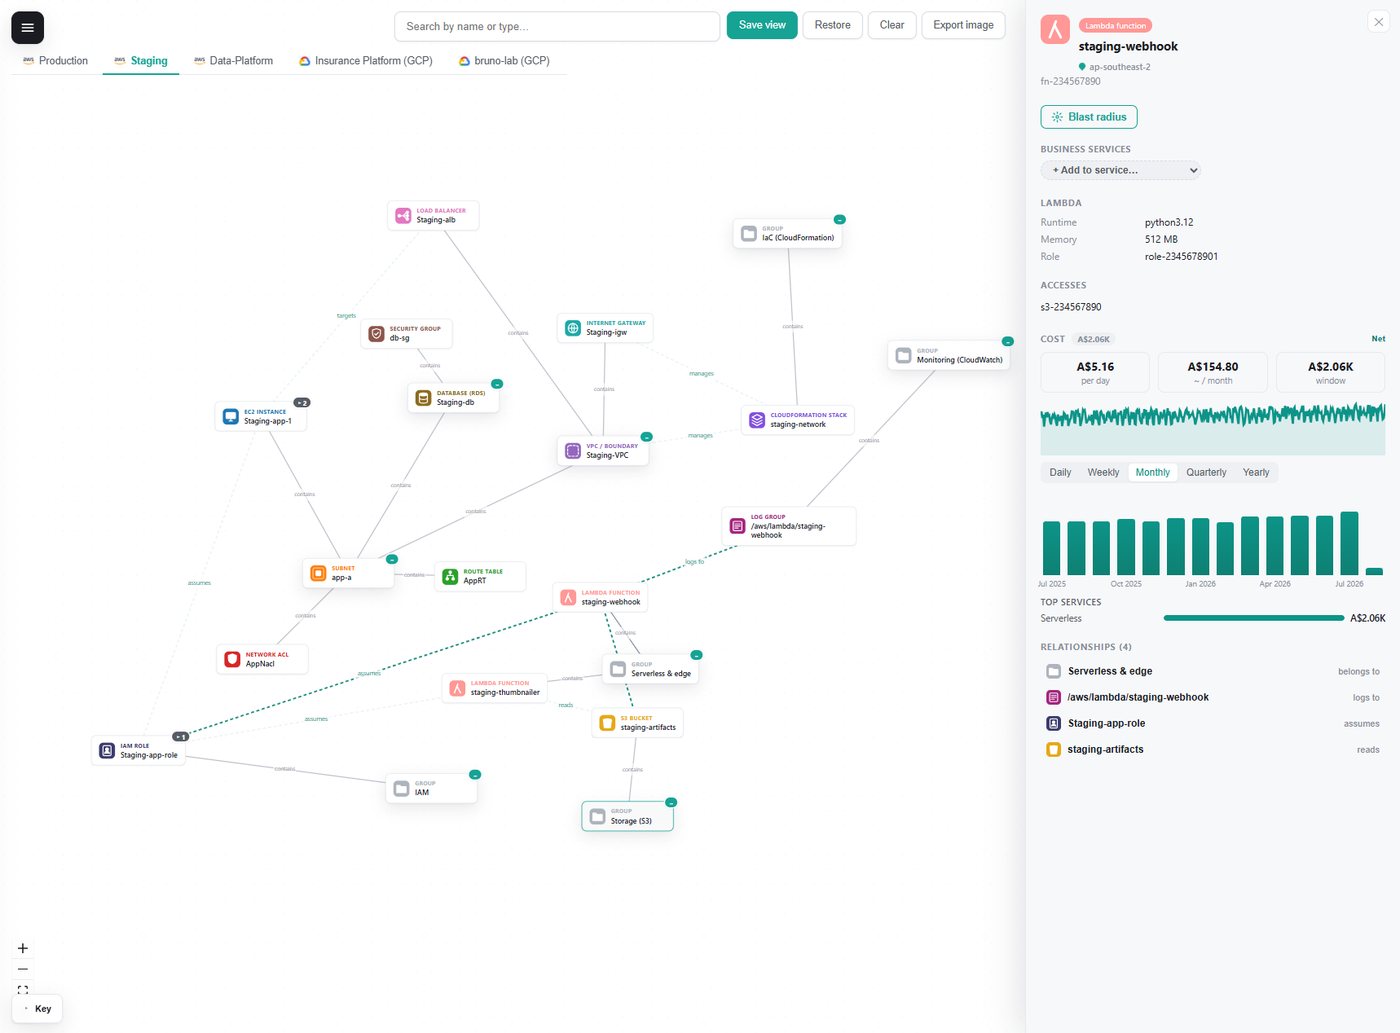
The relationship map
The heart of the product is an interactive graph. You start from the account and click to expand: VPC to subnets, subnets to instances, instances to volumes, security groups, roles and log groups. Containment, "uses" and shared relationships are drawn differently, large fan-outs are paged so the canvas stays readable, and clicking never moves the camera or the nodes you already have, which matters more than it sounds when you are tracing a path.
Focus lenses filter the canvas to networking, compute, serverless, databases, storage, secrets, IAM, IaC or monitoring, and compose with a region filter and a Group by Type or Region toggle. A "hide provider-managed defaults" switch removes the noise you do not own: on one real account it took the networking view from 353 nodes to 19.
Business services
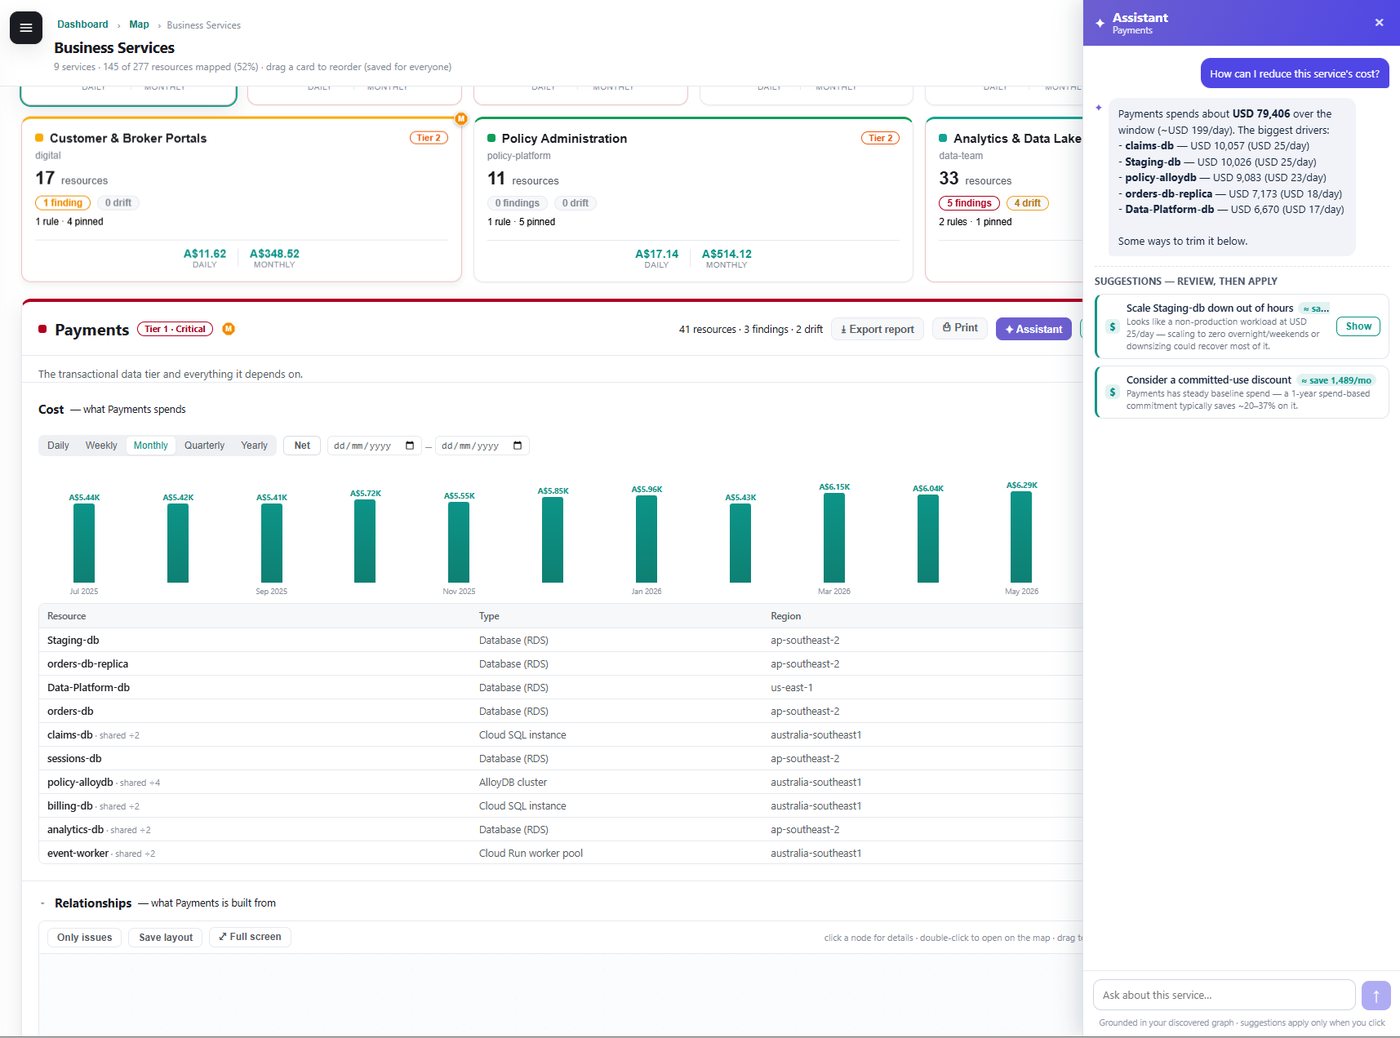
A graph of resources is only useful to the business once it is grouped into the services the business recognises: Payments, Customer Portals, the Data Lake. Membership combines rules (tags, names, types, regions) with relationships on the graph and manual pins, so new resources join their service automatically. Each service gets its own scoped graph, findings, drift, cost and an exportable report.
There is also an assistant, powered by an LLM, that is grounded in the discovered graph. It can only reference resources that actually exist, and its suggestions come back as one-click changes you review and apply rather than prose you have to interpret.
Security findings and drift
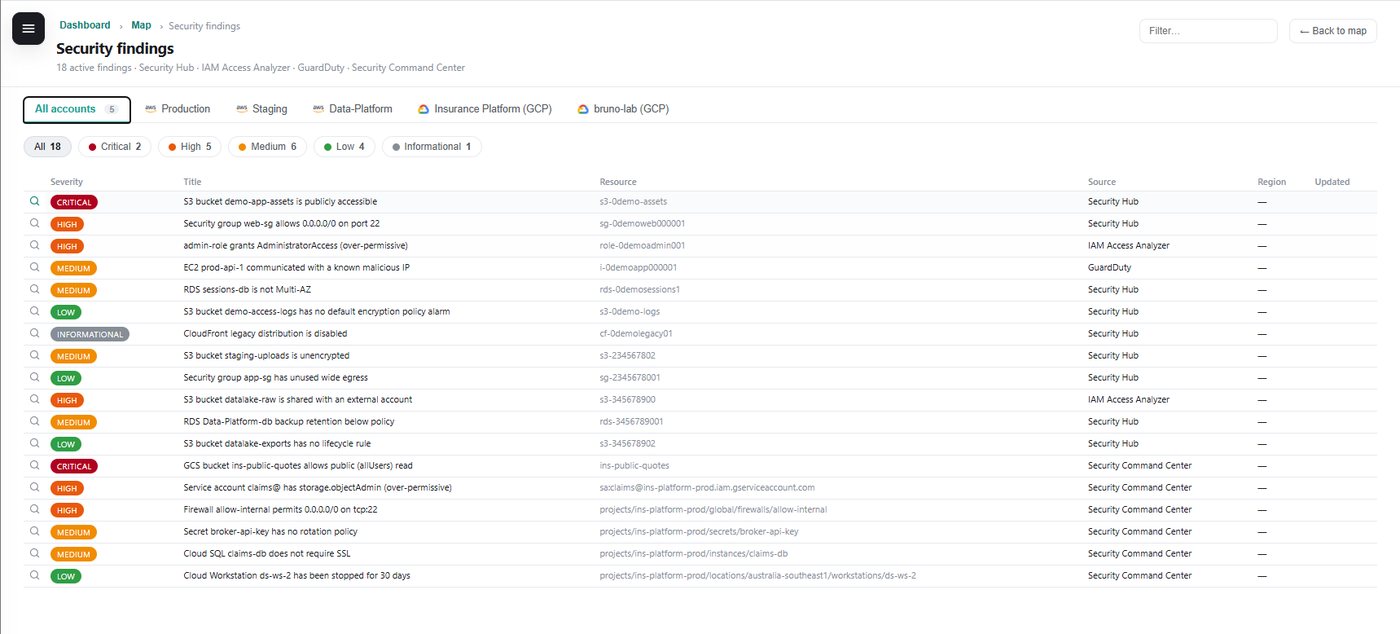
Findings from the providers' native security services are merged into one severity-ranked table across every account and cloud, and every finding links back to the actual node on the map.
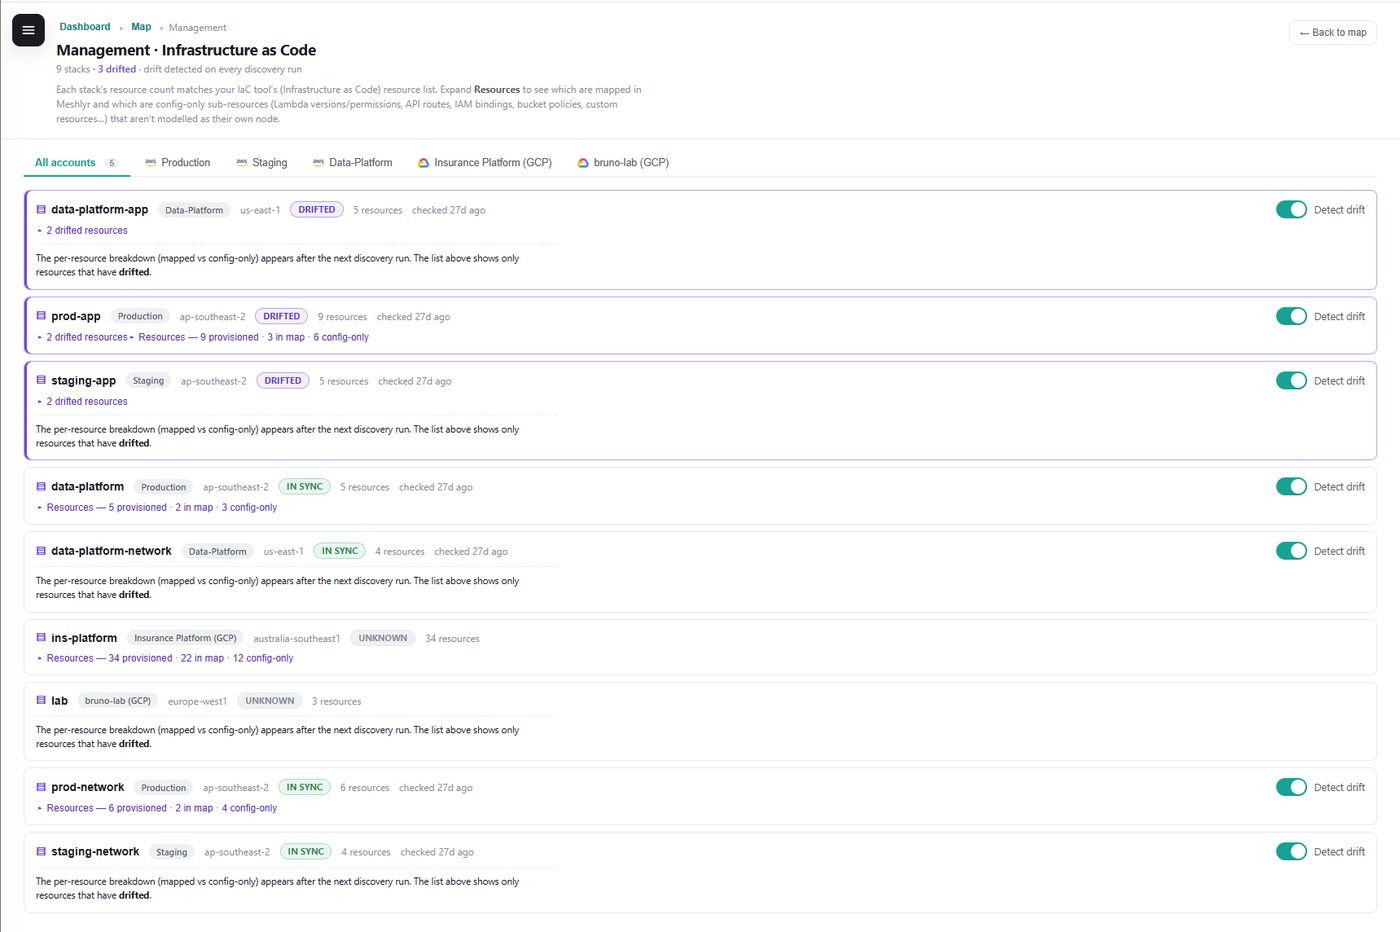
Drift is where the engine earns its keep. Every discovery run is compared with the previous run and with a pinned baseline, and every change is kept with a before-and-now trace. Changes are severity-rated by what they mean rather than what they are: a storage bucket becoming public or a firewall rule opening up is treated very differently from a tag being edited. Noise can be muted at whatever scope makes sense.
Blast radius
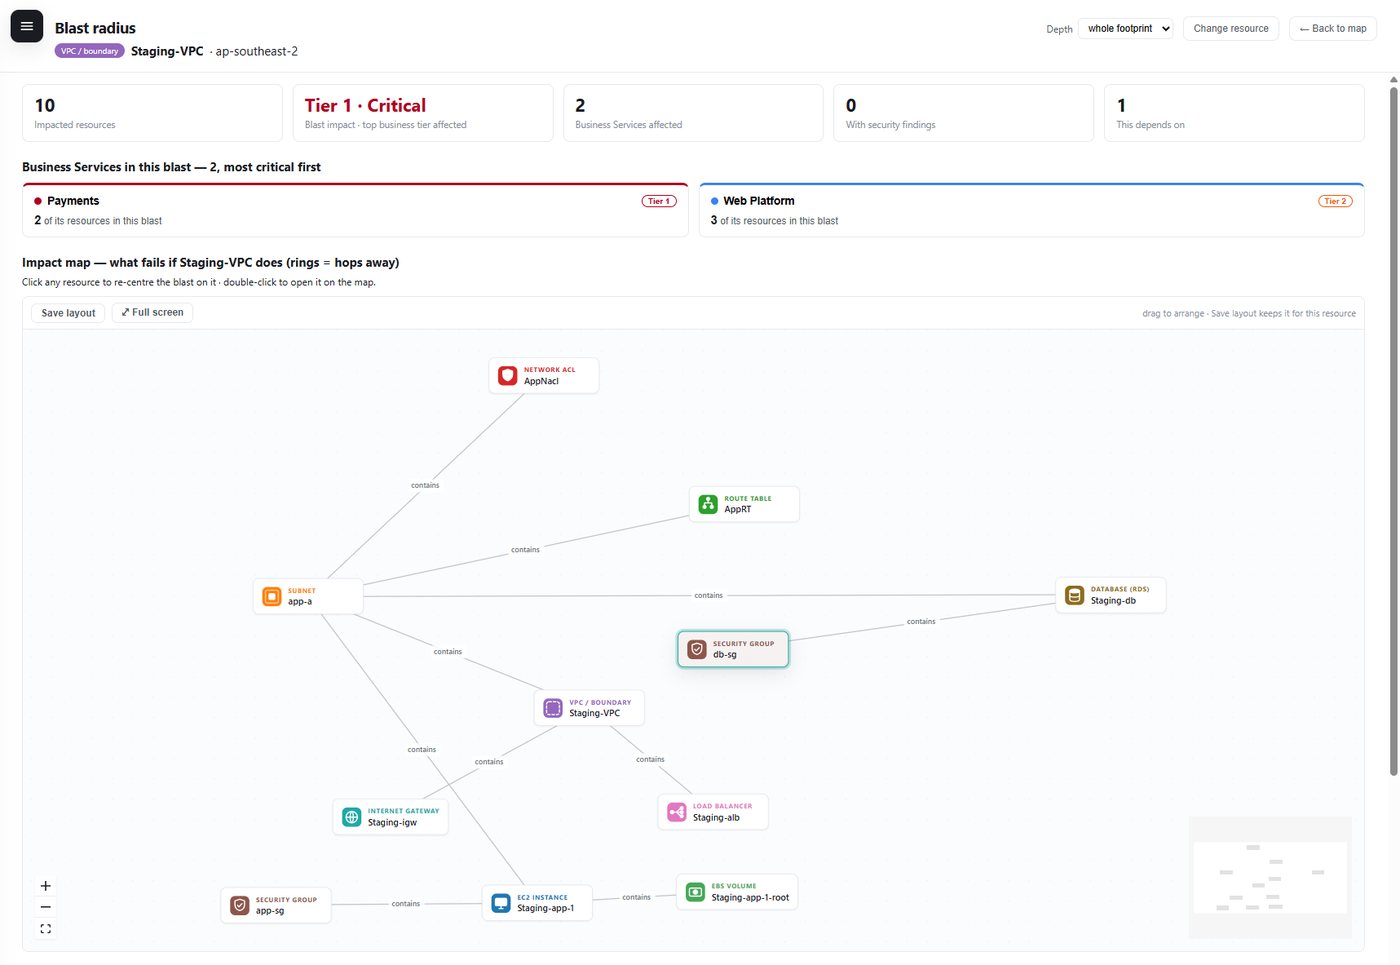
Pick any resource and see everything that depends on it, ring by ring. Edge direction matters here and is the part most tools get wrong: when a database fails, it is the things that use the database that are impacted, not the other way round. Impact is expressed in business terms, because the question that will actually be asked is "is a Tier 1 service affected?"
Cost on every resource
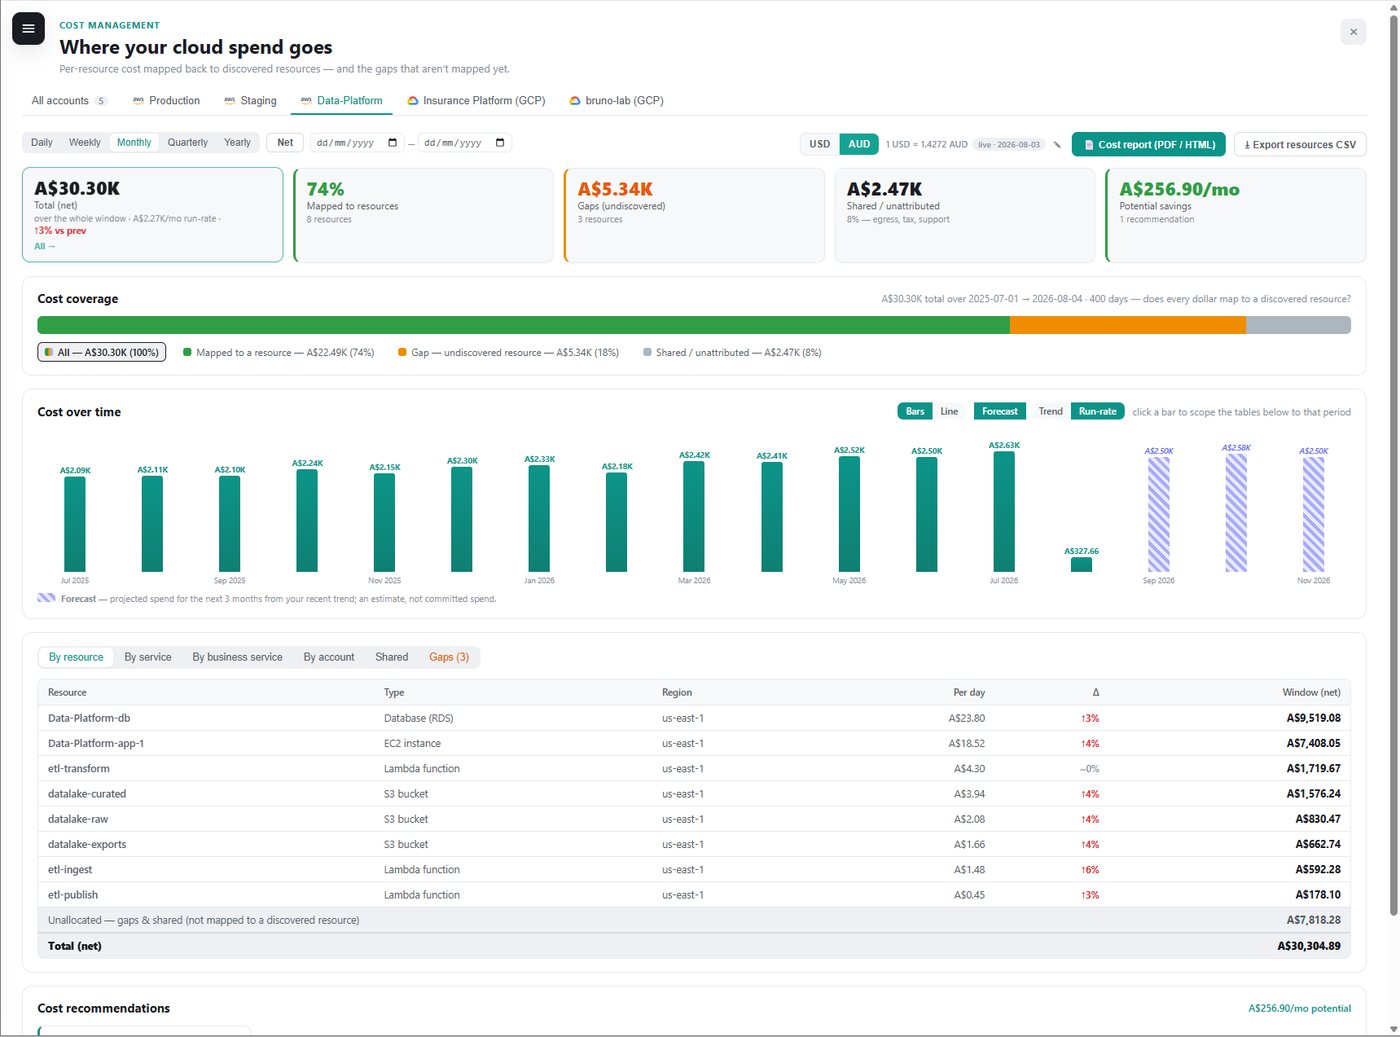
Every resource carries its own daily cost, taken from the providers' detailed billing exports, with net and gross views, coverage reporting and a forecast. Getting this to reconcile with the provider's own console was a project in itself. Billing data and inventory data describe the same resources in different ways, and there are several subtle traps along the way. Recommendations come from three clearly separated sources: the provider's own recommenders, deterministic rules for common waste patterns, and an optional LLM advisor whose suggestions are labelled as advisory and can never claim a saving larger than what the resource has actually cost.
Architecture diagrams you can export
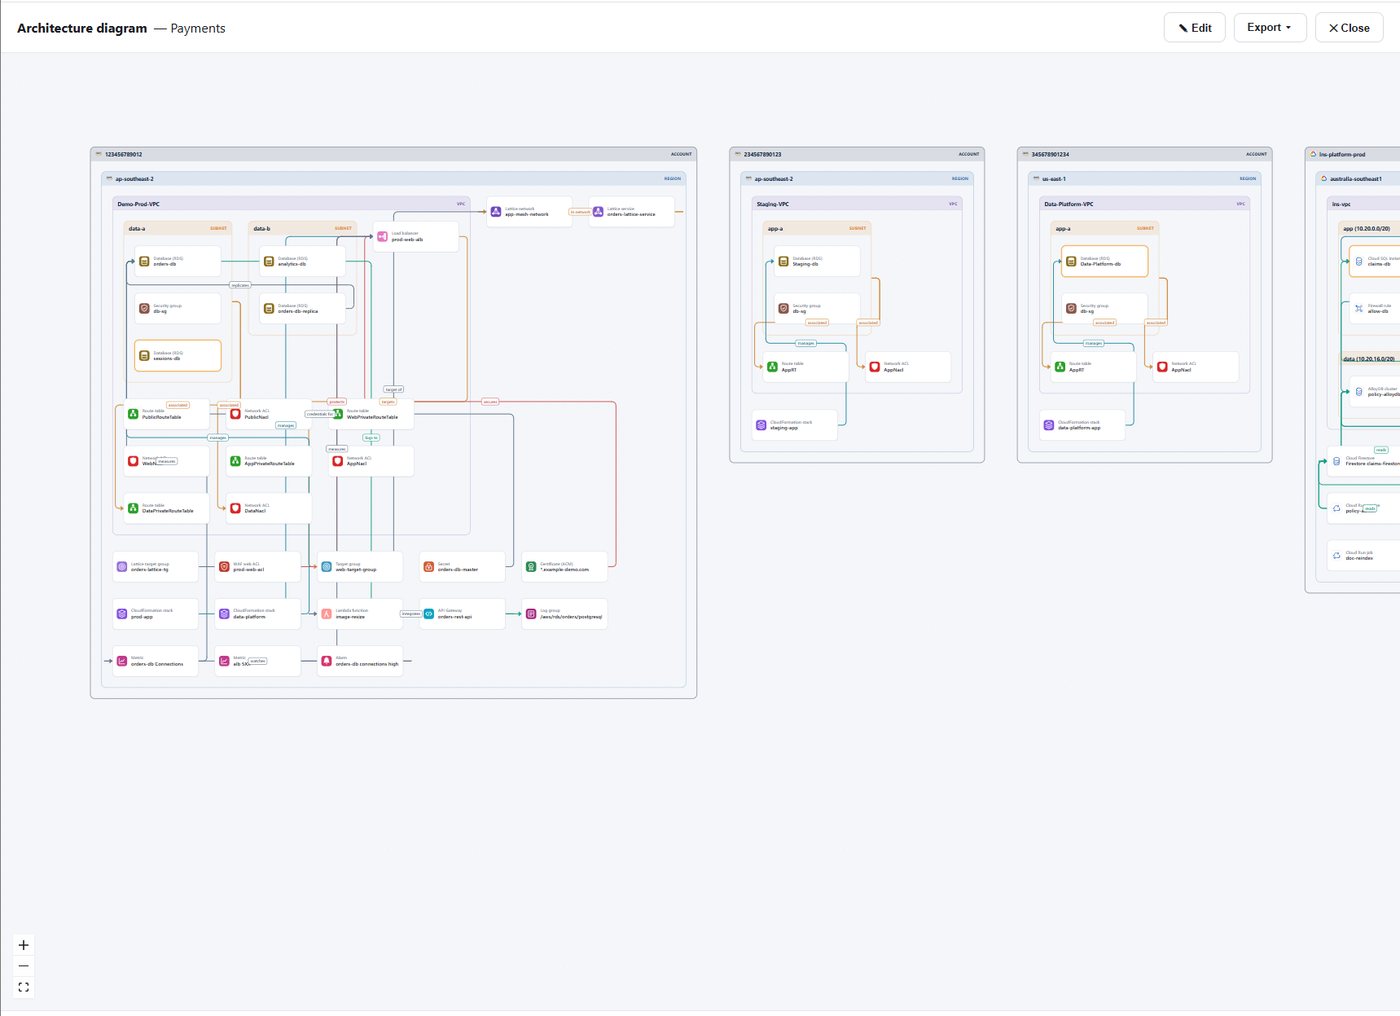
The same graph renders as a conventional nested architecture diagram (account, region, network, subnet, resource) using official cloud icons, exportable to PNG, SVG and draw.io. The editor understands which connections are legal, so it will not let you draw something that cannot exist in the real cloud.
Architecture
The control plane runs serverless on AWS. Discovery never happens on the request path: a daily schedule (or a "Discover now" click) fans out one discovery per connected account, the results are stored as a snapshot, and the web tier only ever reads the latest snapshot. Page loads never wait on a cloud API.
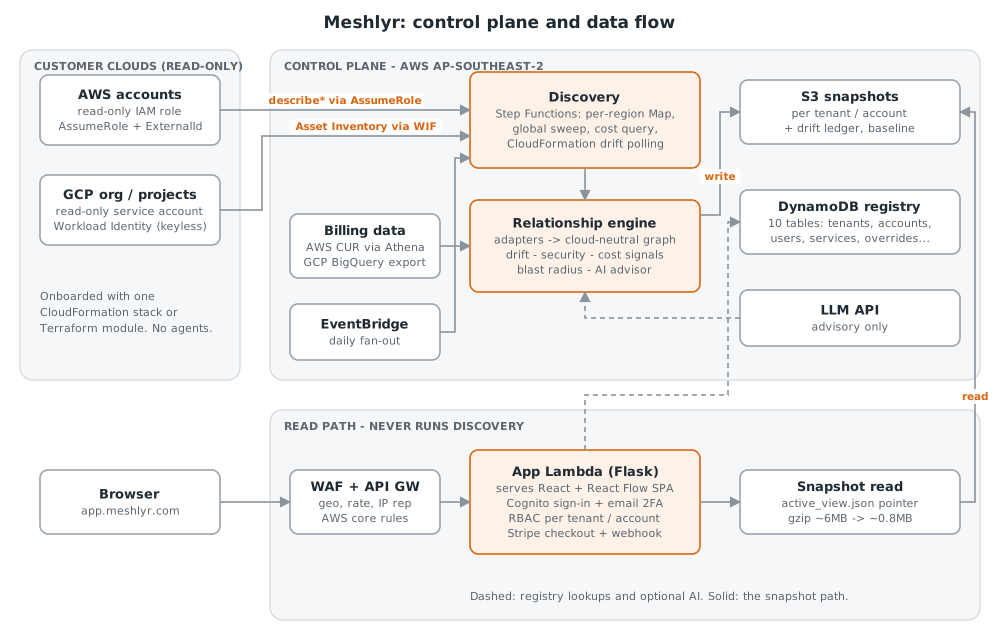
- Onboarding is infrastructure-as-code, with no agents. On AWS the customer deploys a small CloudFormation stack that creates a read-only role trusting only our control plane, protected against the confused-deputy problem. On GCP it is a Terraform module using Workload Identity Federation, so no service-account key is ever created, which matters because most enterprises block key creation by policy anyway.
- Discovery is orchestrated, not monolithic. It runs as a Step Functions workflow that sweeps regions in parallel and isolates failures, so one misbehaving region reports itself rather than sinking the whole run.
- Read-only, metadata only. Secrets, parameters and certificates are discovered for their configuration (rotation, expiry, access policy) and never their values.
- Multi-tenant from day one. Every request derives the tenant and role from a verified sign-in token, never from anything the browser sends, with per-account permission levels and always-on two-factor sign-in.
- Versioned permissions. As the discovery permission set grows, the app detects customers running an older role template and offers an in-place update.
The Common Model
The design principle I have been strictest about: only the discovery adapter is cloud-specific. Each cloud has a thin adapter that translates native resources into one cloud-neutral model, and every feature (drift, blast radius, business impact, cost) is a query over that one graph.
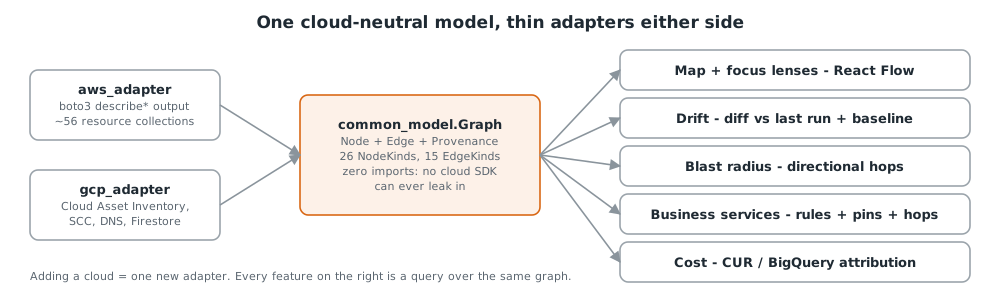
GCP was fitted to the model after AWS, which is the harder direction and the real test of the idea. It worked: a GCP project flows through exactly the same pipeline and every page renders it with no provider-specific UI logic. Every relationship also records how the engine knows it exists, so a relationship inferred by an LLM or drawn by a person is never confused with one declared by a cloud API.
Lessons Learnt
- Never make a customer redo their infrastructure-as-code because of something you did. Removing and re-adding an account once invalidated the trust the customer had already deployed. Removal is now reversible.
- Prove a migration with a structural diff, not a smoke test. Before the new discovery workflow became the default, both paths ran against the same account and their graphs were compared node for node. That surfaced a subtle identity collision no test would have caught.
- An error is not the same as "found nothing". Treating the two the same once let a temporary credential problem blank a panel for most of a day.
- Measure, don't assume. An animation that was "self-stopping" turned out to be running most of the time. Assumptions about efficiency are worth exactly what you measured.
Meshlyr is free during the early-access pilot. Have a play with the open demo, or reach out if you would like to connect a real account.